Tutorial 1: CPTAC Data Introduction
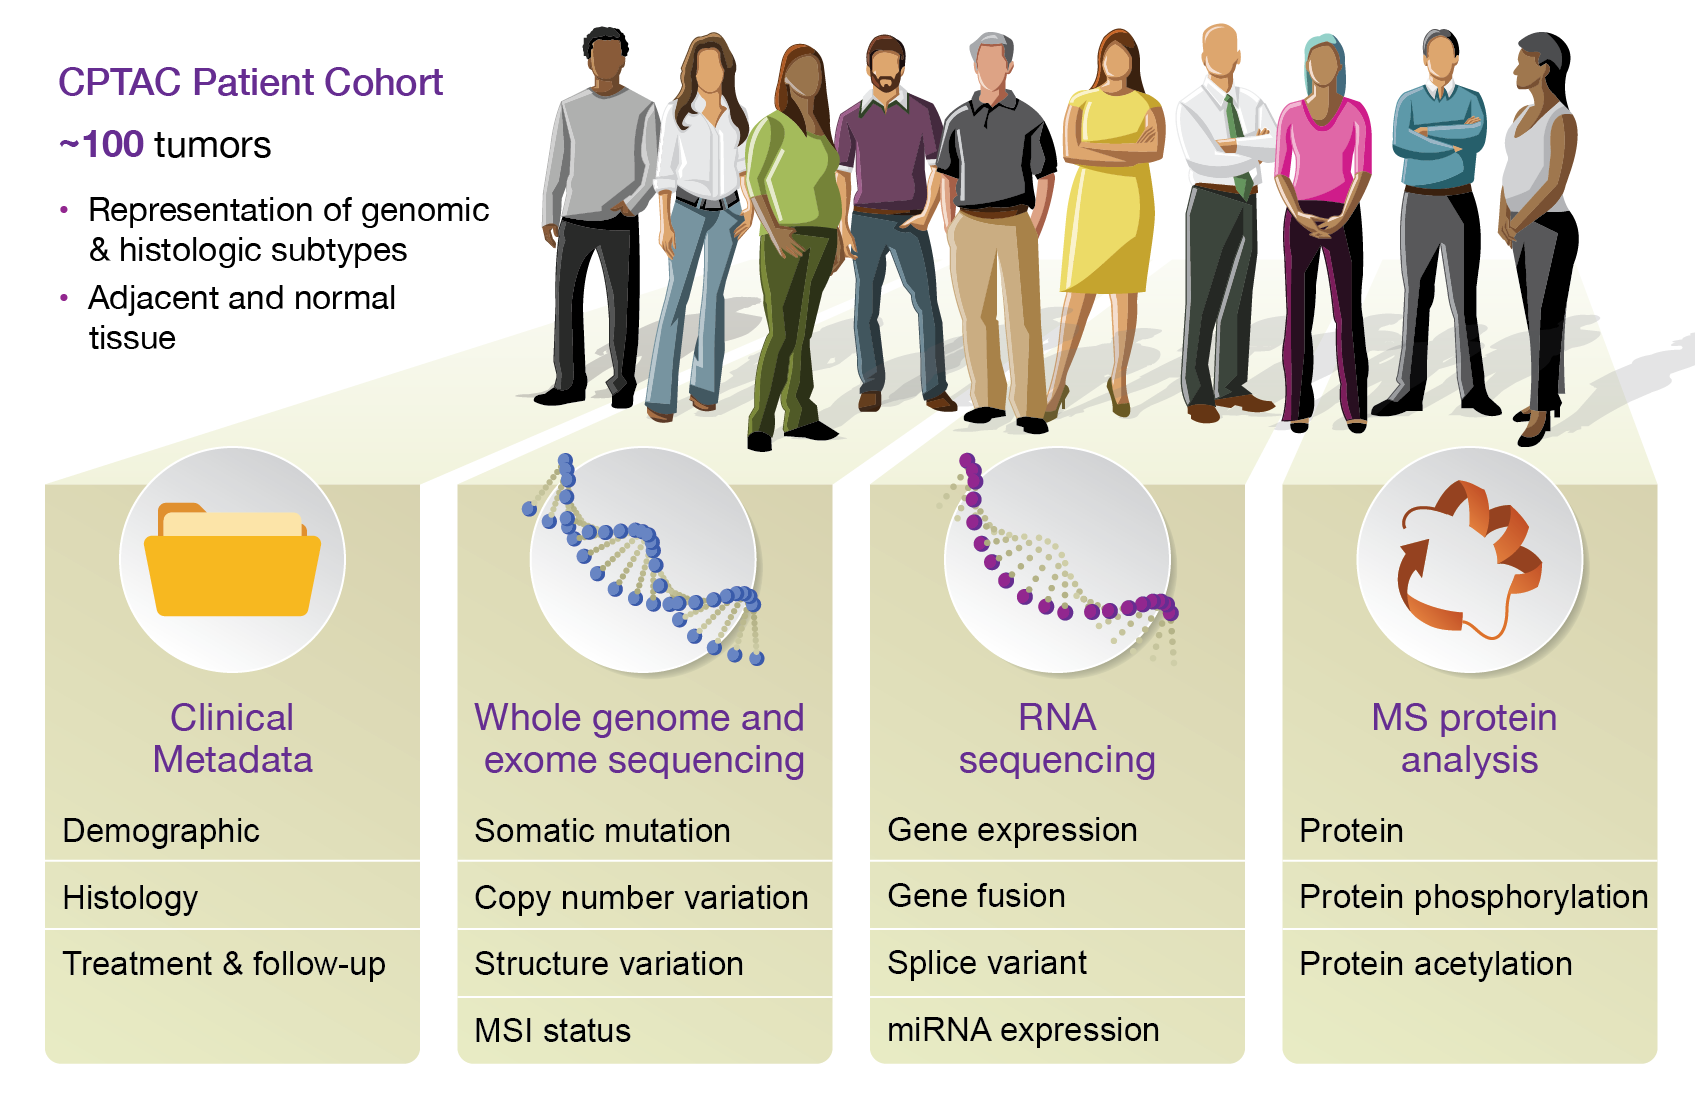
The National Cancer Institute’s Clinical Proteomic Tumor Analysis Consortium (CPTAC) is a national effort to accelerate the understanding of the molecular basis of cancer through the application of large-scale proteome and genome analysis, or proteogenomics. CPTAC generates comprehensive proteomics and genomics data from clinical cohorts, typically with ~100 samples per tumor type. The graphic below summarizes the structure of each CPTAC dataset. For more information, visit the NIH website.
This Python package makes accessing CPTAC data easy with Python code and Jupyter notebooks. The package contains several tutorials which demonstrate data access and usage. This first tutorial serves as an introduction to the data to help users become familiar with what is included and how it is presented.
Data Overview
Our package provides data access in a Python programming environment. If you have not installed Python or have not installed the package, see our installation documentation here.
Once we have the package installed and we're in our Python environment, we begin by importing the package with a standard Python import statement:
import cptac
cptac data is broken down into datasets by cancer type. To view the available cancers and their abbreviations, call the cptac.get_cancer_info() function.
cptac.get_cancer_info()
{'brca': 'Breast invasive carcinoma',
 'ccrcc': 'Clear cell renal cell carcinoma',
 'coad': 'Colon adenocarcinoma',
 'gbm': 'Glioblastoma multiforme',
 'hnscc': 'Head and Neck squamous cell carcinoma',
 'lscc': 'Lung squamous cell carcinoma',
 'luad': 'Lung adenocarcinoma',
 'ov': 'Ovarian serous cystadenocarcinoma',
 'pda': 'Pancreatic ductal adenocarcinoma',
 'pdac': 'Pancreatic ductal adenocarcinoma',
 'ucec': 'Uterine Corpus Endometrial Carcinoma'}
Now to understand the data types that are present call the cptac.get_cancer_options() function. You will note that sometimes a datatype has multiple sources. These represent different computational pipelines run by different bioinformatics groups. For example, the transcriptomics data has both bcm and broad as sources, designating that there are different versions of transcriptomics data create by the groups at Baylor College of Medicine and The Broad. As shown down below, wherever you request a dataframe, you need to specify a source.
cptac.get_source_options()
| Cancer | ||
|---|---|---|
| Source | Datatype | |
| bcm | CNV | [gbm, ccrcc, brca, ucec, coad, pdac, luad, ov,... |
| circular_RNA | [gbm, ccrcc, ucec, pdac, luad, lscc, hnscc] | |
| miRNA | [gbm, ccrcc, brca, ucec, coad, pdac, luad, lsc... | |
| phosphoproteomics | [gbm, ccrcc, brca, ucec, coad, pdac, luad, ov,... | |
| proteomics | [gbm, ccrcc, brca, ucec, coad, pdac, luad, ov,... | |
| transcriptomics | [gbm, ccrcc, brca, ucec, coad, pdac, luad, ov,... | |
| broad | transcriptomics | [gbm, ccrcc, brca, ucec, coad, pdac, luad, ov,... |
| harmonized | ancestry_prediction | [all_cancers] |
| somatic_mutation | [all_cancers] | |
| mssm | clinical | [all_cancers] |
| umich | acetylproteomics | [gbm, brca, ucec, luad, lscc] |
| phosphoproteomics | [gbm, ccrcc, brca, ucec, coad, pdac, luad, lsc... | |
| proteomics | [gbm, ccrcc, brca, ucec, coad, pdac, luad, ov,... | |
| washu | CNV | [gbm, ccrcc, brca, ucec, coad, pdac, luad, ov,... |
| cibersort | [gbm, ccrcc, brca, ucec, coad, pdac, luad, ov,... | |
| hla_typing | [all_cancers] | |
| mature_miRNA | [gbm, ccrcc, ucec, pdac, luad, lscc, hnscc] | |
| precursor_miRNA | [gbm, ccrcc, ucec, pdac, luad, lscc, hnscc] | |
| somatic_mutation | [gbm, ucec, coad, pdac, luad, ov, lscc, hnscc] | |
| total_miRNA | [gbm, ccrcc, ucec, pdac, luad, lscc, hnscc] | |
| transcriptomics | [gbm, ccrcc, brca, ucec, coad, pdac, luad, ov,... | |
| tumor_purity | [all_cancers] | |
| xcell | [gbm, ccrcc, brca, ucec, coad, pdac, luad, ov,... |
Exploring the data
cptac allows you to load the dataset into a Python variable, and you can use that variable to access and work with the data. To load a particular dataset into a variable, type the name you want to give the variable, followed by =, and then type cptac. and the name of the dataset in UpperCamelCase followed by two parentheses, e.g. cptac.Ucec() or cptac.Ccrcc():
en = cptac.Ucec()
To see what data is available, use the en.list_data_sources() function. This displays the different types of data included in the dataset for this particular cancer type, each stored in a pandas dataframe.
en.list_data_sources()
| Data type | Available sources | |
|---|---|---|
| 0 | CNV | [bcm, washu] |
| 1 | circular_RNA | [bcm] |
| 2 | miRNA | [bcm, washu] |
| 3 | proteomics | [bcm, umich] |
| 4 | transcriptomics | [bcm, broad, washu] |
| 5 | ancestry_prediction | [harmonized] |
| 6 | somatic_mutation | [harmonized, washu] |
| 7 | clinical | [mssm] |
| 8 | follow-up | [mssm] |
| 9 | medical_history | [mssm] |
| 10 | acetylproteomics | [umich] |
| 11 | phosphoproteomics | [umich] |
| 12 | cibersort | [washu] |
| 13 | hla_typing | [washu] |
| 14 | tumor_purity | [washu] |
| 15 | xcell | [washu] |
Molecular Omics
Data can be accessed through the get_dataframe function, or through one of several helper "get" functions. For example, we can look at the proteomics data by using en.get_proteomics(). This returns a pandas dataframe containing the proteomic data. Each column in the proteomics dataframe is the quantitiative measurement for a particular protein. Each row in the proteomics dataframe is a sample of either a tumor or non-tumor from a cancer patient.
# These two methods of getting proteomics data are functionally equivalent:
# get_dataframe needs at least two arguments: datatype, and source
proteomics = en.get_dataframe('proteomics', 'umich')
# there is also a get function for each datatype, this is the same as get_dataframe
# but does not need the datatype argument. This function call below is equivalent to
# the one above
proteomics = en.get_proteomics('umich')

samples = proteomics.index
proteins = proteomics.columns
print("Samples:",samples[0:20].tolist()) #the first twenty samples
print("Proteins:",proteins[0:20].tolist()) #the first twenty proteins
Samples: ['C3L-00006', 'C3L-00008', 'C3L-00032', 'C3L-00084', 'C3L-00090', 'C3L-00098', 'C3L-00136', 'C3L-00137', 'C3L-00139', 'C3L-00143', 'C3L-00145', 'C3L-00156', 'C3L-00157', 'C3L-00161', 'C3L-00356', 'C3L-00358', 'C3L-00361', 'C3L-00362', 'C3L-00413', 'C3L-00449']
Proteins: [('ARF5', 'ENSP00000000233.5'), ('M6PR', 'ENSP00000000412.3'), ('ESRRA', 'ENSP00000000442.6'), ('FKBP4', 'ENSP00000001008.4'), ('NDUFAF7', 'ENSP00000002125.4'), ('FUCA2', 'ENSP00000002165.5'), ('DBNDD1', 'ENSP00000002501.6'), ('SEMA3F', 'ENSP00000002829.3'), ('CFTR', 'ENSP00000003084.6'), ('CYP51A1', 'ENSP00000003100.8'), ('USP28', 'ENSP00000003302.4'), ('SLC7A2', 'ENSP00000004531.10'), ('HSPB6', 'ENSP00000004982.3'), ('PDK4', 'ENSP00000005178.5'), ('USH1C', 'ENSP00000005226.7'), ('RALA', 'ENSP00000005257.2'), ('BAIAP2L1', 'ENSP00000005260.8'), ('TMEM132A', 'ENSP00000005286.4'), ('DVL2', 'ENSP00000005340.4'), ('RPAP3', 'ENSP00000005386.3')]
Dataframe values
Values in the dataframe are protein abundance values. Values that read "NaN" mean that particular sample from that patient had no data for that particular protein. In CPTAC proteomics data, a TMT-reference channel strategy was used. A detailed description of this strategy can be found at Nature Protocols and also at PubMed Central. This strategy ratios each sample's abundance to a pooled reference. The ratio is then log transformed. Therefore positive values indicate a measurement higher than the pooled reference; negative values are lower than the pooled reference.
proteomics.head()
| Name | ARF5 | M6PR | ESRRA | FKBP4 | NDUFAF7 | FUCA2 | DBNDD1 | SEMA3F | CFTR | CYP51A1 | ... | SCRIB | WIZ | BPIFB4 | LDB1 | WIZ | TSGA10 | RFX7 | SWSAP1 | MSANTD2 | SVIL |
|---|---|---|---|---|---|---|---|---|---|---|---|---|---|---|---|---|---|---|---|---|---|
| Database_ID | ENSP00000000233.5 | ENSP00000000412.3 | ENSP00000000442.6 | ENSP00000001008.4 | ENSP00000002125.4 | ENSP00000002165.5 | ENSP00000002501.6 | ENSP00000002829.3 | ENSP00000003084.6 | ENSP00000003100.8 | ... | ENSP00000501177.1 | ENSP00000501256.3 | ENSP00000501266.1 | ENSP00000501277.1 | ENSP00000501300.1 | ENSP00000501312.1 | ENSP00000501317.1 | ENSP00000501355.1 | ENSP00000501466.1 | ENSP00000501521.1 |
| Patient_ID | |||||||||||||||||||||
| C3L-00006 | -0.056513 | 0.016557 | 0.002569 | 0.389819 | 0.603610 | -0.332543 | -0.790426 | NaN | 0.822732 | 0.039134 | ... | 0.161720 | -0.884807 | NaN | 0.268247 | 0.125392 | -0.880833 | 0.108554 | 0.107413 | -0.085833 | NaN |
| C3L-00008 | 0.549959 | -0.206129 | 0.905784 | -0.303631 | 0.018767 | 0.503513 | 0.950955 | 0.080142 | NaN | -0.063213 | ... | NaN | 0.054284 | NaN | -0.106450 | 0.380557 | -0.756099 | 0.264611 | 0.044423 | -0.248319 | -1.206596 |
| C3L-00032 | 0.088681 | -0.154447 | -0.190515 | 0.170753 | 0.196356 | 0.544194 | -0.179078 | NaN | NaN | 0.377405 | ... | -1.086905 | 0.055991 | NaN | -0.021986 | -0.229645 | 1.923986 | NaN | -0.176694 | -0.332384 | -1.330653 |
| C3L-00084 | -0.846555 | 0.027740 | NaN | 0.178700 | 0.264054 | -0.183548 | 0.077215 | -0.247164 | 0.152277 | -0.279549 | ... | -0.125796 | 0.944212 | NaN | 0.917409 | 0.026862 | -0.885976 | -0.006510 | -0.014162 | 0.365158 | NaN |
| C3L-00090 | 0.539019 | 0.956619 | -0.039516 | 0.323656 | 0.064605 | 0.173433 | -0.524325 | -0.038590 | -0.311486 | 0.309905 | ... | 0.853362 | -0.716947 | NaN | -0.286277 | -0.046076 | 0.089645 | -0.444506 | -0.072531 | -0.463495 | NaN |
5 rows × 12662 columns
As seen in en.list_data_sources(), other omics data are also available (e.g. transcriptomics, copy number variation, phoshoproteomics).
The transcriptomics looks almost identical to the proteomics data, available in a pandas dataframe with the same convention. Each set of samples is consistent, meaning samples found in the endometrial proteomics data will be the same samples in all other endometrial dataframes.
transcriptomics = en.get_transcriptomics('bcm')
transcriptomics.head()
cptac warning: Your version of cptac (1.5.1) is out-of-date. Latest is 1.5.0. Please run 'pip install --upgrade cptac' to update it. (C:\Users\sabme\anaconda3\lib\threading.py, line 910)
| Name | A1BG | A1BG-AS1 | A1CF | A2M | A2M-AS1 | A2ML1 | A2ML1-AS1 | A2ML1-AS2 | A2MP1 | A3GALT2 | ... | ZXDB | ZXDC | ZYG11A | ZYG11AP1 | ZYG11B | ZYX | ZYXP1 | ZZEF1 | hsa-mir-1253 | hsa-mir-423 |
|---|---|---|---|---|---|---|---|---|---|---|---|---|---|---|---|---|---|---|---|---|---|
| Database_ID | ENSG00000121410.12 | ENSG00000268895.6 | ENSG00000148584.15 | ENSG00000175899.15 | ENSG00000245105.4 | ENSG00000166535.20 | ENSG00000256661.1 | ENSG00000256904.1 | ENSG00000256069.7 | ENSG00000184389.9 | ... | ENSG00000198455.4 | ENSG00000070476.15 | ENSG00000203995.10 | ENSG00000232242.2 | ENSG00000162378.13 | ENSG00000159840.16 | ENSG00000274572.1 | ENSG00000074755.15 | ENSG00000272920.1 | ENSG00000266919.3 |
| Patient_ID | |||||||||||||||||||||
| C3L-00006 | 2.54 | 5.11 | 3.60 | 13.75 | 6.45 | 7.08 | 1.80 | 0.00 | 2.60 | 1.16 | ... | 10.17 | 10.61 | 5.54 | 0.0 | 11.85 | 10.60 | 0.0 | 11.87 | 0.0 | 0.0 |
| C3L-00008 | 4.40 | 4.63 | 5.49 | 13.89 | 6.61 | 6.97 | 0.00 | 2.74 | 3.25 | 0.00 | ... | 9.79 | 10.48 | 7.79 | 0.0 | 12.28 | 11.28 | 0.0 | 11.93 | 0.0 | 0.0 |
| C3L-00032 | 4.83 | 7.26 | 3.73 | 14.48 | 6.91 | 9.56 | 0.98 | 0.00 | 3.26 | 0.00 | ... | 9.43 | 9.97 | 6.48 | 0.0 | 11.72 | 10.37 | 0.0 | 11.70 | 0.0 | 0.0 |
| C3L-00084 | 4.73 | 6.01 | 5.37 | 15.17 | 7.93 | 3.86 | 0.00 | 0.00 | 3.73 | 1.15 | ... | 9.23 | 10.37 | 7.47 | 0.0 | 11.86 | 10.13 | 0.0 | 11.19 | 0.0 | 0.0 |
| C3L-00090 | 4.14 | 6.24 | 5.69 | 13.87 | 6.79 | 4.32 | 0.00 | 0.00 | 3.23 | 0.00 | ... | 9.69 | 9.64 | 7.60 | 0.0 | 11.98 | 10.31 | 0.0 | 11.45 | 0.0 | 0.0 |
5 rows × 59286 columns
Clinical Data
The clinical dataframe lists clinical information for the patient associated with each sample (e.g. age, race, diabetes status, tumor size).
clinical = en.get_clinical('mssm')
clinical.head()
| Name | tumor_code | discovery_study | type_of_analyzed_samples | confirmatory_study | type_of_analyzed_samples | age | sex | race | ethnicity | ethnicity_race_ancestry_identified | ... | additional_treatment_pharmaceutical_therapy_for_new_tumor | additional_treatment_immuno_for_new_tumor | number_of_days_from_date_of_initial_pathologic_diagnosis_to_date_of_additional_surgery_for_new_tumor_event_loco-regional | number_of_days_from_date_of_initial_pathologic_diagnosis_to_date_of_additional_surgery_for_new_tumor_event_metastasis | Recurrence-free survival, days | Recurrence-free survival from collection, days | Recurrence status (1, yes; 0, no) | Overall survival, days | Overall survival from collection, days | Survival status (1, dead; 0, alive) |
|---|---|---|---|---|---|---|---|---|---|---|---|---|---|---|---|---|---|---|---|---|---|
| Patient_ID | |||||||||||||||||||||
| C3L-00006 | UCEC | Yes | Tumor_and_Normal | NaN | NaN | 64 | Female | White | Not Hispanic or Latino | White | ... | NaN | NaN | NaN | NaN | NaN | NaN | 0 | 737.0 | 737.0 | 0.0 |
| C3L-00008 | UCEC | Yes | Tumor | NaN | NaN | 58 | Female | White | Not Hispanic or Latino | White | ... | NaN | NaN | NaN | NaN | NaN | NaN | 0 | 898.0 | 898.0 | 0.0 |
| C3L-00032 | UCEC | Yes | Tumor | NaN | NaN | 50 | Female | White | Not Hispanic or Latino | White | ... | NaN | NaN | NaN | NaN | NaN | NaN | 0 | 1710.0 | 1710.0 | 0.0 |
| C3L-00084 | UCEC | Yes | Tumor | NaN | NaN | 74 | Female | White | Not Hispanic or Latino | White | ... | NaN | NaN | NaN | NaN | NaN | NaN | 0 | 335.0 | 335.0 | 0.0 |
| C3L-00090 | UCEC | Yes | Tumor | NaN | NaN | 75 | Female | White | Not Hispanic or Latino | White | ... | Yes | No | NaN | NaN | 50.0 | 56.0 | 1 | 1281.0 | 1287.0 | 1.0 |
5 rows × 124 columns
In addition to donating a tumor sample, some patients also had a normal sample taken for control and comparison. We can identify these samples by looking for samples marked "Tumor_and_Normal" in the "type_of_analyzed_samples" column. For example, patient C3L-00006 provided both a tumor sample and a normal sample. Since the data in these cases is for both tumor and normal samples, where a column would have identical values for both samples from the same patient (e.g., patient age and gender), the information is recorded only for the tumor sample.
clinical.loc[["C3L-00006","C3L-00361","C3L-01246"]]
| Name | tumor_code | discovery_study | type_of_analyzed_samples | confirmatory_study | type_of_analyzed_samples | age | sex | race | ethnicity | ethnicity_race_ancestry_identified | ... | additional_treatment_pharmaceutical_therapy_for_new_tumor | additional_treatment_immuno_for_new_tumor | number_of_days_from_date_of_initial_pathologic_diagnosis_to_date_of_additional_surgery_for_new_tumor_event_loco-regional | number_of_days_from_date_of_initial_pathologic_diagnosis_to_date_of_additional_surgery_for_new_tumor_event_metastasis | Recurrence-free survival, days | Recurrence-free survival from collection, days | Recurrence status (1, yes; 0, no) | Overall survival, days | Overall survival from collection, days | Survival status (1, dead; 0, alive) |
|---|---|---|---|---|---|---|---|---|---|---|---|---|---|---|---|---|---|---|---|---|---|
| Patient_ID | |||||||||||||||||||||
| C3L-00006 | UCEC | Yes | Tumor_and_Normal | NaN | NaN | 64 | Female | White | Not Hispanic or Latino | White | ... | NaN | NaN | NaN | NaN | NaN | NaN | 0 | 737.0 | 737.0 | 0.0 |
| C3L-00361 | UCEC | Yes | Tumor_and_Normal | NaN | NaN | 64 | Female | White | Not Hispanic or Latino | WHITE | ... | NaN | NaN | NaN | NaN | NaN | NaN | 0 | 1707.0 | 1707.0 | 0.0 |
| C3L-01246 | UCEC | Yes | Tumor_and_Normal | NaN | NaN | 62 | Female | White | Unknown | Medical record does not state. | ... | NaN | NaN | NaN | NaN | NaN | NaN | 0 | 1538.0 | 1524.0 | 0.0 |
3 rows × 124 columns
Mutation data
Each cancer dataset contains mutation data for the cohort. The data consists of all somatic mutations found for each sample (meaning there will be many lines for each sample). Each row lists the specific gene that was mutated, the type of mutation, and the location of the mutation. This data is a direct import of a MAF file.
somatic_mutations = en.get_somatic_mutation('harmonized')
somatic_mutations.head()
| Name | Gene | Mutation | Location | Entrez_Gene_Id | NCBI_Build | Chromosome | Start_Position | End_Position | Strand | Variant_Type | ... | HGNC_UniProt_ID(supplied_by_UniProt) | HGNC_Ensembl_ID(supplied_by_Ensembl) | HGNC_UCSC_ID(supplied_by_UCSC) | Oreganno_Build | Simple_Uniprot_alt_uniprot_accessions | dbSNP_TOPMED | HGNC_Entrez_Gene_ID(supplied_by_NCBI) | COHORT | getz | washu |
|---|---|---|---|---|---|---|---|---|---|---|---|---|---|---|---|---|---|---|---|---|---|
| Patient_ID | |||||||||||||||||||||
| C3L-00006 | TEKT5 | Silent | p.C178C | 146279.0 | hg38 | chr16 | 10694340 | 10694340 | + | SNP | ... | Q96M29 | ENSG00000153060 | uc002czz.2 | NaN | A1L3Z3 | 0.99969737512742099,0.00030262487257900 | 146279.0 | UCEC | True | NaN |
| C3L-00006 | AK9 | Missense_Mutation | p.A1819V | 221264.0 | hg38 | chr6 | 109494058 | 109494058 | + | SNP | ... | Q5TCS8 | ENSG00000155085 | NaN | NaN | A6NL75|B2RDJ0|B6ZDM7|Q3MIS4|Q5I0W8|Q6ZNF1|Q6ZV... | NaN | 221264.0 | UCEC | True | True |
| C3L-00006 | FYN | Missense_Mutation | p.T15M | 2534.0 | hg38 | chr6 | 111720008 | 111720008 | + | SNP | ... | P06241 | ENSG00000010810 | uc003pvk.3 | NaN | B5BU57|E1P557|H0UI48|Q16248|Q5R3A6|Q5R3A7|Q8N5D7 | NaN | 2534.0 | UCEC | True | True |
| C3L-00006 | LAMA4 | Missense_Mutation | p.T206I | 3910.0 | hg38 | chr6 | 112191737 | 112191737 | + | SNP | ... | Q16363 | ENSG00000112769 | uc003pvv.4 | hg38 | Q14731|Q14735|Q15335|Q4LE44|Q5SZG8|Q9BTB8|Q9UE... | NaN | 3910.0 | UCEC | True | True |
| C3L-00006 | MARCKS | Missense_Mutation | p.A129V | 4082.0 | hg38 | chr6 | 113859966 | 113859966 | + | SNP | ... | P29966 | ENSG00000277443 | uc032xir.2 | NaN | E1P560|Q2LA83|Q5TDB7 | NaN | 4082.0 | UCEC | True | True |
5 rows × 131 columns
Exporting dataframes
If you wish to export a dataframe to a file, simply call the dataframe's to_csv method, passing the path you wish to save the file to, and the value separator you want:
clinical = en.get_clinical('mssm')
clinical.to_csv(path_or_buf="clinical_dataframe.tsv", sep='\t')
Downloading data
The cptac package stores the data files for each dataset on a remote server. When you first install cptac, you will have no data files. Data files will be automatically downloaded the first time you try to use them. If you won't have internet access and need to download the files for a specific cancer beforehand, that can be done with the "get" functions:
br = cptac.Brca()
br.get_transcriptomics('broad')
#This downloads and displays the brca transcriptomic data from the "broad" source
| Name | A1BG | A1BG-AS1 | ... | ZZEF1 | hsa-mir-1253 | hsa-mir-423 | |||||||||||||||
|---|---|---|---|---|---|---|---|---|---|---|---|---|---|---|---|---|---|---|---|---|---|
| Transcript_ID | ENST00000263100.8 | ENST00000595014.1 | ENST00000596924.1 | ENST00000598345.1 | ENST00000600966.1 | ENST00000593374.5 | ENST00000593960.5 | ENST00000594950.5 | ENST00000595302.1 | ENST00000599728.5 | ... | ENST00000572426.5 | ENST00000572699.1 | ENST00000572831.1 | ENST00000573183.1 | ENST00000573536.1 | ENST00000573606.2 | ENST00000574474.1 | ENST00000575428.1 | ENST00000609567.1 | ENST00000586878.1 |
| Database_ID | ENSG00000121410.12 | ENSG00000121410.12 | ENSG00000121410.12 | ENSG00000121410.12 | ENSG00000121410.12 | ENSG00000268895.6 | ENSG00000268895.6 | ENSG00000268895.6 | ENSG00000268895.6 | ENSG00000268895.6 | ... | ENSG00000074755.15 | ENSG00000074755.15 | ENSG00000074755.15 | ENSG00000074755.15 | ENSG00000074755.15 | ENSG00000074755.15 | ENSG00000074755.15 | ENSG00000074755.15 | ENSG00000272920.1 | ENSG00000266919.3 |
| Patient_ID | |||||||||||||||||||||
| 01BR001 | 0.0 | 0.06 | 0.15 | 10.13 | 0.00 | 0.0 | 0.21 | 1.26 | 1.28 | 0.0 | ... | 0.27 | 0.62 | 0.00 | 0.00 | 1.38 | 0.19 | 0.14 | 0.00 | 0.0 | 0.0 |
| 01BR008 | 0.0 | 0.09 | 0.06 | 3.12 | 0.11 | 0.0 | 0.00 | 2.98 | 1.94 | 0.0 | ... | 0.05 | 0.12 | 0.00 | 0.00 | 0.74 | 0.27 | 0.03 | 0.00 | 0.0 | 0.0 |
| 01BR009 | 0.0 | 0.13 | 0.47 | 11.88 | 0.00 | 0.0 | 0.00 | 1.22 | 0.10 | 0.0 | ... | 0.32 | 1.19 | 0.00 | 0.00 | 3.53 | 1.55 | 0.32 | 0.28 | 0.0 | 0.0 |
| 01BR010 | 0.0 | 0.16 | 0.25 | 12.34 | 0.00 | 0.0 | 0.41 | 2.05 | 0.79 | 0.0 | ... | 0.30 | 1.66 | 0.00 | 0.00 | 1.60 | 1.21 | 0.10 | 0.00 | 0.0 | 0.0 |
| 01BR015 | 0.0 | 0.04 | 0.39 | 19.99 | 0.00 | 0.0 | 0.00 | 1.93 | 0.79 | 0.0 | ... | 0.77 | 1.29 | 0.48 | 0.00 | 2.08 | 0.50 | 0.36 | 0.00 | 0.0 | 0.0 |
| ... | ... | ... | ... | ... | ... | ... | ... | ... | ... | ... | ... | ... | ... | ... | ... | ... | ... | ... | ... | ... | ... |
| 21BR010 | 0.0 | 0.17 | 0.20 | 1.47 | 0.00 | 0.0 | 0.00 | 0.00 | 0.53 | 0.0 | ... | 1.38 | 0.56 | 0.00 | 0.00 | 1.56 | 0.95 | 0.87 | 0.22 | 0.0 | 0.0 |
| 22BR005 | 0.0 | 0.03 | 0.21 | 2.33 | 0.00 | 0.0 | 0.00 | 0.00 | 0.56 | 0.0 | ... | 0.19 | 0.54 | 0.00 | 0.43 | 1.44 | 0.72 | 0.32 | 0.00 | 0.0 | 0.0 |
| 22BR006 | 0.0 | 0.94 | 0.21 | 4.98 | 0.00 | 0.0 | 0.24 | 0.08 | 1.34 | 0.0 | ... | 1.31 | 1.08 | 0.85 | 0.52 | 3.46 | 0.67 | 0.29 | 0.00 | 0.0 | 0.0 |
| CPT000814 | 0.0 | 0.00 | 0.00 | 21.64 | 0.17 | 0.0 | 0.64 | 2.38 | 1.05 | 0.0 | ... | 0.00 | 0.00 | 0.00 | 0.00 | 0.49 | 0.43 | 0.05 | 0.00 | 0.0 | 0.0 |
| CPT001846 | 0.0 | 0.05 | 0.07 | 51.13 | 0.05 | 0.0 | 0.83 | 2.24 | 0.65 | 0.0 | ... | 0.06 | 0.00 | 0.00 | 0.13 | 0.14 | 0.00 | 0.02 | 0.00 | 0.0 | 0.0 |
121 rows × 225997 columns
Getting help with a dataset or function
To view the documentation for a dataset, pass it to the Python help function, e.g. help(en). You can also view the documentation for just a specific function: help(en.join_omics_to_omics).
help(en.join_omics_to_omics)
Help on method join_omics_to_omics in module cptac.cancers.cancer:

join_omics_to_omics(df1_name: str, df2_name: str, df1_source: str = None, df2_source: str = None, genes1: str = None, genes2: str = None, how: str = 'outer', quiet: bool = False, tissue_type: str = 'both') -> pandas.core.frame.DataFrame method of cptac.cancers.ucec.Ucec instance
    Take specified column(s) from one omics dataframe, and join to specified columns(s) from another omics dataframe. Intersection (inner join) of indices is used.

    Parameters:
    df1_name (str): Name of first omics dataframe to select columns from.
    df2_name (str): Name of second omics dataframe to select columns from.
    df1_source (str): Name of source for the first omics dataframe.
    df2_source (str): Name of source for the second omics dataframe.
    genes1 (str, or list or array-like of str, optional): Gene(s) for column(s) to select from df1_name. str if one key, list or array-like of str if multiple.
        Default of None will select entire dataframe.
    genes2 (str, or list or array-like of str, optional): Gene(s) for Column(s) to select from df2_name. str if one key, list or array-like of str if multiple.
        Default of None will select entire dataframe.
    how (str, optional): How to perform the join, acceptable values are from ['outer', 'inner', 'left', 'right']. Defaults to 'outer'.
    quiet (bool, optional): Whether to warn when inserting NaNs. Defaults to False.
    tissue_type (str): Acceptable values in ["tumor","normal","both"]. Specifies the desired tissue type for the dataframe. Defaults to "both".

    Returns:
    pandas.DataFrame: The selected columns from the two omics dataframes, joined into one dataframe.